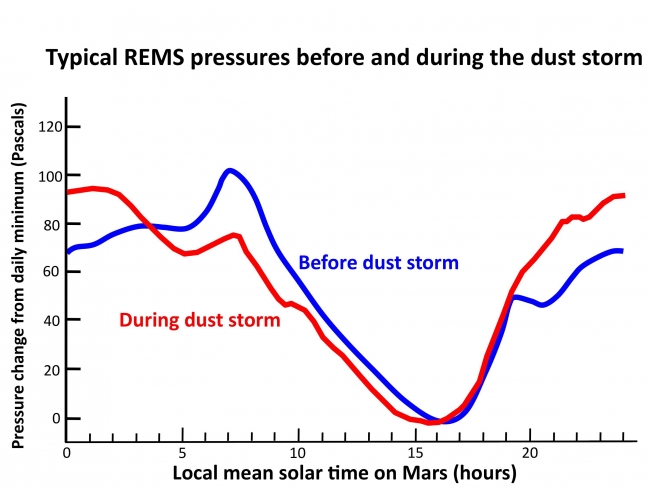
Atmospheric Pressure Patterns Before and During Dust Storm, This graph compares a typical daily pattern of changing atmospheric pressure (blue) with the pattern during a regional dust storm hundreds of miles away (red...

Atmospheric Pressure Patterns Before and During Dust Storm


This graph compares a typical daily pattern of changing atmospheric pressure (blue) with the pattern during a regional dust storm hundreds of miles away (red). The data are by the Rover Environmental Monitoring Station (REMS) on NASA's Curiosity rover. Pressure is a measure of the amount of air in the whole column of atmosphere sitting above the rover. The altered pattern in pressure variation during the storm results from changes both in large-scale atmospheric heating due to dust in the air and from more local atmospheric heating due to an increase in local dustiness. NASA's Jet Propulsion Laboratory, a division of the California Institute of Technology, Pasadena, manages the Mars Science Laboratory Project for NASA's Science Mission Directorate, Washington. JPL designed and built the rover. For more information about Curiosity and its mission, visit: http://www.nasa.gov/msl and http://mars.jpl.nasa.gov/msl .

Image credits: NASA/JPL-Caltech/CAB(CSIC-INTA)/FMI/Ashima Research
Image released by NASA on 2012-11-27 as catalog id PIA16455
This photo was taken 11 years ago and uploaded to photonado 11 years ago
34 views.

Photostream

photo: photo: photo: photo: photo:

Tags

License

cc-by-nc Attribution-NonCommercial

Privacy

This photo is visible for everyone

Flag this photo

Flag this photo

Metadata

Original size:  2999x2249
Full metadata.

Share this photo

Link to this photo
Embed this photo